Project managers are always grappling with the demands involved in project planning, and the many moving parts that encompass it. The crux of managing projects involves keeping the project’s resources, tasks, and timeline defined in clear sight so that project managers can keep a comprehensive view of the project, as well as identify areas in the project planning where additional review is needed. Visual project management tools such as PERT and Gantt charts are two of the many scheduling techniques that can be utilized to serve this purpose. Visual representation of a project’s workflow can offer the following benefits:
- Streamline the entire duration of the project.
- Clear communication of what needs to be done, and when.
- Easy tracking of project progress.
Knowing which charting techniques to utilize can vary depending on the nature of the project and management needs. Here’s a rundown of some of the two commonly used charting techniques being used today:
Gantt
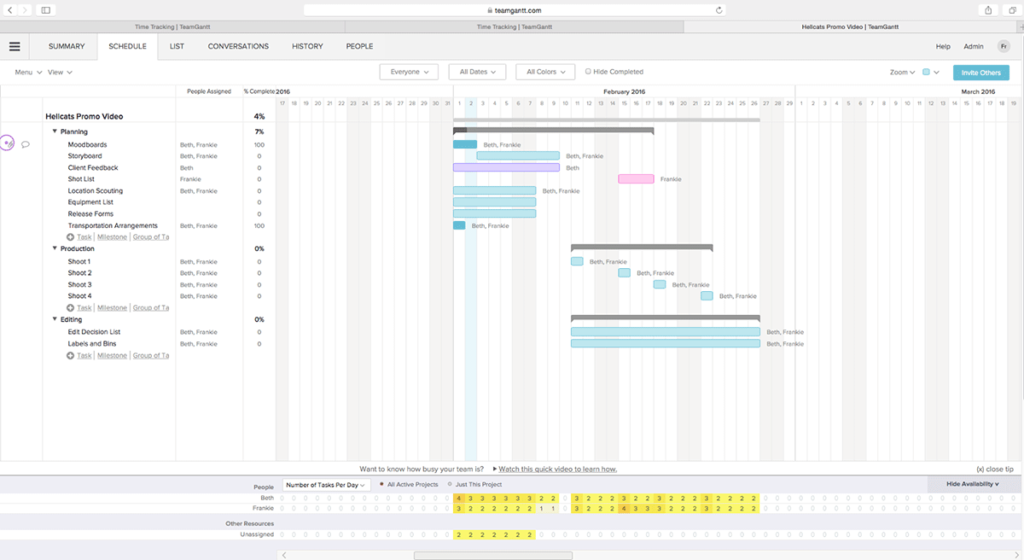
Gantt charts are centered on using bar graphs to depict the full breakdown of all the tasks that are part of the project. A Gantt chart will consist of a vertical axis that contains the complete list of tasks to be accomplished, and a horizontal axis which contains bars of varying lengths to indicate the duration of each task in chronological order. Gantt charts provide a convenient way of visualizing the entire project to ensure proper time management by breaking down the project into many steps. Advantages of Gantt charts include:
- Clear depiction of timeframes and tasks to be completed.
- Easy means of grouping subtasks under a main task.
- Easy tracking of tasks that are lagging behind anticipated completion date.
- Offers room for adaptation if certain tasks stray from anticipated completion date.
PERT
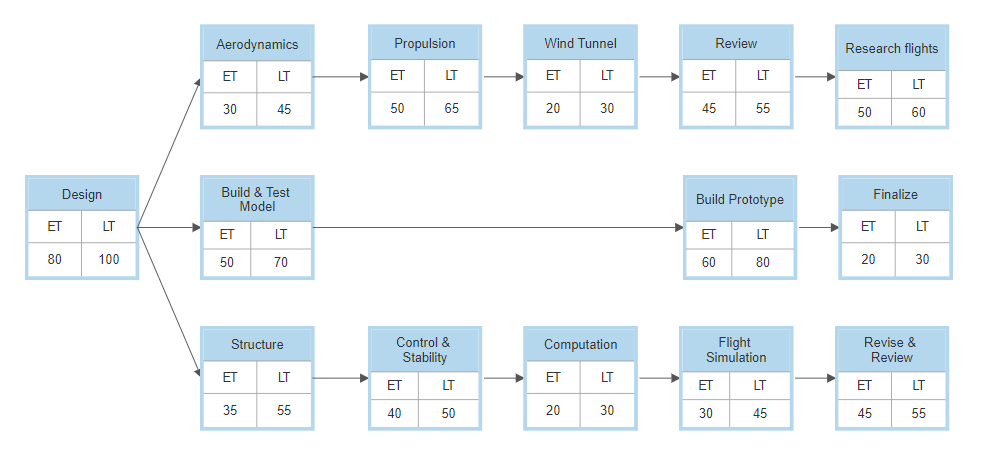
PERT charts consist of a series of nodes representing events in a project, which are then connected via directed arrows to indicate the time and tasks that are required to complete each event/milestone. A core aspect of PERT charts is that they well-suited for depicting relationships between tasks in a project. PERT charts serve well in providing management with a view of the minimum time to complete a project, as well as aiding with risk assessment. Advantages of PERT charts:
- Provides a means of depicting the entire scope of a project from start to finish, while also developing alternative plans to meet deadlines.
- Depicts critical paths, which are the sequence of events in the chart which require greatest time to complete.
- Depicts dependencies between paths.
Project Management Software
With the basic background on these graphing techniques in tow, here are some project scheduling software to consider when seeking to incorporate scheduling graphs into your project.
TeamGantt
Known for being a beginner-friendly project management tool, TeamGantt offers just enough for smaller sized project endeavors. The tool mainly caters to Gantt charts, but also offers other collaboration and sharing features. TeamGantt offers a free version to support one project for personal use. Standard plans start at $24.95/mo.

SmartDraw
SmartDraw is a cloud-based chart creator that offers many templates to help you jumpstart your project graphs. Templates are available for both PERT and Gantt charts. The tool also allows you to integrate with other tools such as Microsoft Word, Excel, Powerpoint, and Google Workspace, so that you can seamlessly transfer diagrams to other platforms. Pricing starts at $5.95/mo for 5+ users.

Creately
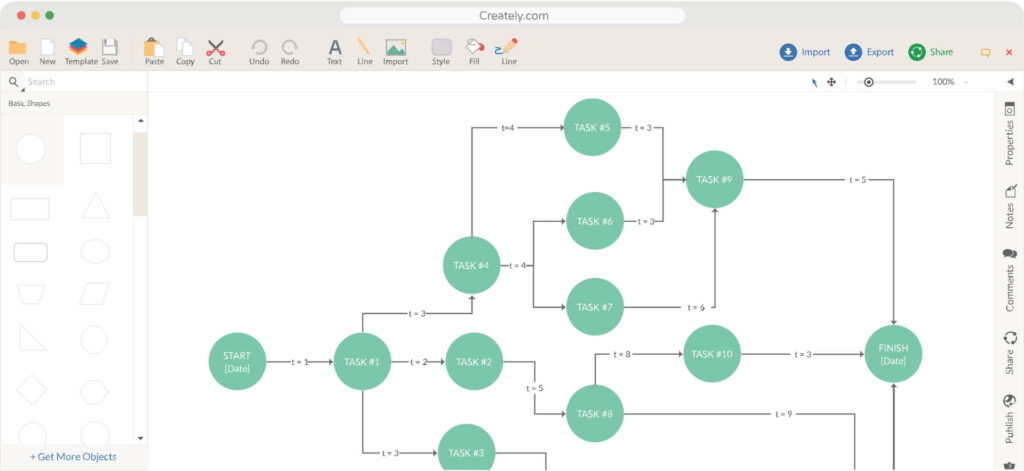
This diagramming tool is capable of creating anything from flowcharts to mind maps and engineering diagrams. Creately features thousands of templates to select from, and features a very intuitive and clean user interface. Team plans start at $6/mo per user.

Knowing which project management tool to select will vary on your/your organization’s needs. Things like cost, versatility, and available features are some of the main factors to consider. It may be wise to first seek out tool that offer free trials so that you can get the most in-depth look at the product before making the final decision.
7 Comments
Autumn Coulton · March 8, 2021 at 9:24 pm
Good post Vivian, with a detailed description for both PERT and Gantt charts. Is there one you prefer over the other? Personally I like Gantt charts over PERT charts because I find looking at it visually, it is easier to understand the timeframes compared to a PERT chart. Including different software that can be used to create the charts was a nice touch and will be helpful in the future to know when we need to make one!
Brandon Kresge · March 9, 2021 at 10:40 am
Really well-detailed summary. I find it interesting that there are different software that do the same if not similar things. I feel like Creately seems the most useful, since it is not just for PERT and GANTT charts like the other two. I find GANTT charts easier to follow. I myself have tried Excel for making them and it can be kind of a pain to work with. Using a software is highly recommended if there is a free one or one that fits within a given budget.
Sean Kinneer · March 9, 2021 at 1:15 pm
This is very-organized and detailed. You did a really good job, Vivian. I like how you gave details on both the GANTT and PERT charts. The explanation and advantages bullets really helped me understand the importance of the two types of charts. I like that you gave three examples of Project management tools as well. That is something that is important for project managers to research. The tools used can make a difference depending on personal preference or job specifics. I have only heard of TeamGantt. Thank you for the suggestions. I will investigate the other two you included. The pictures were a nice touch as well. They showed us examples of how the interfaces look. Overall, very well done!
Trisha Badlu · March 9, 2021 at 3:03 pm
Great post Vivian! The descriptions for both the Gantt and PERT charts were very clear and easy to understand. I agree that choosing which chart to use depends on management needs. I think Gantt charts are more user-friendly, so these might be better if the scheduling plan needs to be shown to a client that isn’t familiar with these kinds of scheduling tools. However, PERT charts might overall be a better option to go for since Gantt charts don’t show dependencies which can make it harder to determine how to allocate resources efficiently and know which tasks can be afforded to be delayed.
Connor Ellis · March 9, 2021 at 4:29 pm
Pert and GANTT chart scheduling was one of the first things we did in 354 with Professor Demarco. As you state, keeping everyone on the same page with project progress is very important. I can imagine how blind to the big picture teams are if they don’t have a way of keeping everyone informed on progress. Seeing a project begin to take shape through good scheduling must be a great motivator for employees. Great post!
Griffin Nye · March 9, 2021 at 5:29 pm
Great post, Vivian! The summaries of the GANT and PERT charts were very detailed and informative. I also really liked how you included recommendations for software for creating these charts, which was a very impressive touch! I believe that this is one of the most important topics when it comes to managing a project, as a project will only be as good as its schedule. If the project and its tasks are not well-defined and scheduled, the likeliness of the project succeeding is very low, as its members will not have a clear expectation of what’s expected of them nor a vision of the larger and greater purpose the task serves.
Manogna Pillutla · March 9, 2021 at 5:36 pm
Good post Vivian! Very well elaborated and organized. Focusing the visual representation was important. I never had experience with these charts and this is very helpful.