What is Quality Control?
Quality Control is a collective term for activities and techniques, within the process, that are intended to create specific quality characteristics.
Project Managers are responsible for providing a quality product or service that meets or exceeds customer and industry expectations. Because of this, project managers must employ good methods and practice in quality control.
The main activities in quality control include the continuous monitoring of processes, identification and elimination of problem causes, and the use of statistical process control to reduce the variability and increase the efficiency of processes.
A Good Quality Control System will:
- Select what is controlled
- Set decision standards for corrections
- Establish measurement methods
- Compare actual results to quality standards
- Correct all non-conforming items back to standards
- Monitor and recalibrate measurement devices
- Provide detailed documentation for all processes

Quality Control uses Statistical Process Control (SPC) to provide:
- Improved process information
- Better communication
- Discussion based on facts
- Consensus for action
- Information for process changes
There are seven tools that are used in SPC; data figures, cause and effect analysis, histograms, Pareto analysis, scatter diagrams, trend analysis, and process control charts.
- Data Figures
- are featured as data tables or data arrays, these provide a systematic method for collecting and displaying information.
- Cause and Effect Analysis
- makes use of diagramming techniques to identify relationships between a given effect and possible causes.
- Histograms
- are graphical representations of data set up as a pass/fail frequency distribution. These provide visuals for quick analysis.
- Pareto Analysis
- Uses Pareto diagrams, specific type of histograms, to help identify and prioritize problem areas.
- 3 types:
- Basic – identifies key few contributors
- Comparative – focuses on any number of options
- Weighted – provides measures of significance such as cost, time, and criticality.
- Scatter Diagrams
- organize collected data using two variable, one dependent and the other independent on graph featuring X and Y coordinates to show relationship between factors.
- Trend Analysis
- statistical method used to quantify relationships between inputs and outputs, determine an equation, and measure that equation in relation to the data featured in the scatter plot.
- Process Control Charts
- Focuses mainly on the prevention of defects, not the detection of rejection, and use normal distribution.
- There are 2 main types of control charts:
- variable charts for use of continuous data
- attribute charts for use of discrete data
6 Comments
Trisha Badlu · April 12, 2021 at 1:44 pm
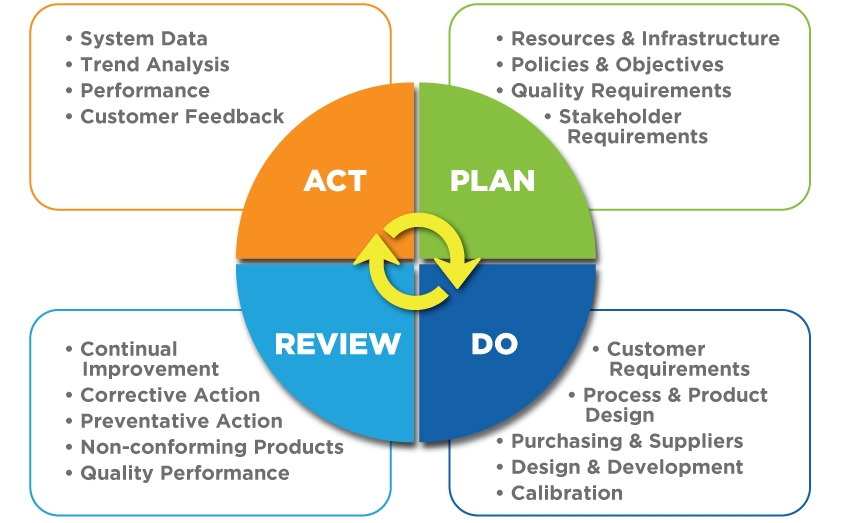
Nice post Sean! The picture also really helps to understand how quality control is a continuous process and what kinds of tasks need to be completed to ensure high quality. The descriptions for the tools are also really helpful. There are a few tools listed that I’m not familiar with, but it seems like they’re worth looking into.
Savannah Swartzel · April 13, 2021 at 9:13 am
I like that you showed that quality control never stops. The “Act, Plan, Do, Review” picture really brings the idea to the front. It doesn’t ever stop because once you have a quality product you never stop checking and updating to ensure that it stays a quality product.
Chris Kelly · April 13, 2021 at 3:57 pm
Good post, Sean! I find it interesting that the 7 tools listed can be applied in any situation; they can work in pretty much any business.
I also looked up what a Pareto Diagram is, if anyone was wondering: “A Pareto chart is a bar graph. The lengths of the bars represent frequency or cost (time or money), and are arranged with longest bars on the left and the shortest to the right. In this way the chart visually depicts which situations are more significant.”
Manogna Pillutla · April 13, 2021 at 4:44 pm
Good one Sean! This is very detailed and well-put post. Diagram with its own sub points was good to have. It made things easy to understand. I liked the way you have explained on what is the use of SPC and then talked about tools used in SPC. Its interesting!
Henok Araya · April 13, 2021 at 5:05 pm
Very informative post, I like the use of diagram and the several tools that can be used in SPC.
Brandon Kresge · April 13, 2021 at 5:06 pm
Really well organized. I like the picture, too. The article was really interesting for me since I have not heard of a lot of the information in here. I do think pictures of variable and attribute charts would help, if possible.